Ingress Performance Test Report
Test Background
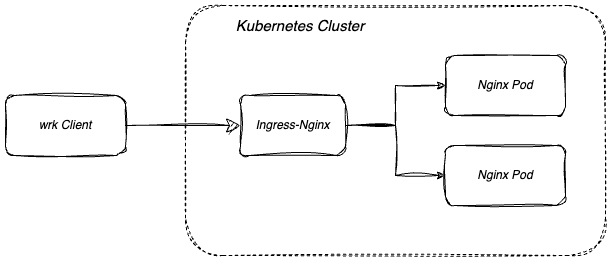
Verify that the throughput of Ingress-nginx can increase linearly after horizontal scaling, and understand its performance metrics to help users manage resources effectively.
Benchmark
This article is based on the installation of Ingress-Nginx in DCE 5.0, with all parameters set to default configuration and without enabling features such as keepalive.
Physical Machine
| Name | CPU | CPU | MEM | Interface |
|---|---|---|---|---|
| Node 1 | Intel(R) Xeon(R) CPU E5-2680 v4 @ 2.40GHz | 56C | 128G | 10G Mellanox |
| Node 2 | Intel(R) Xeon(R) CPU E5-2680 v4 @ 2.40GHz | 56C | 128G | 10G Mellanox |
| wrk Client | Intel(R) Xeon(R) CPU E5-2680 v4 @ 2.40GHz | 56C | 128G | 10G Mellanox |
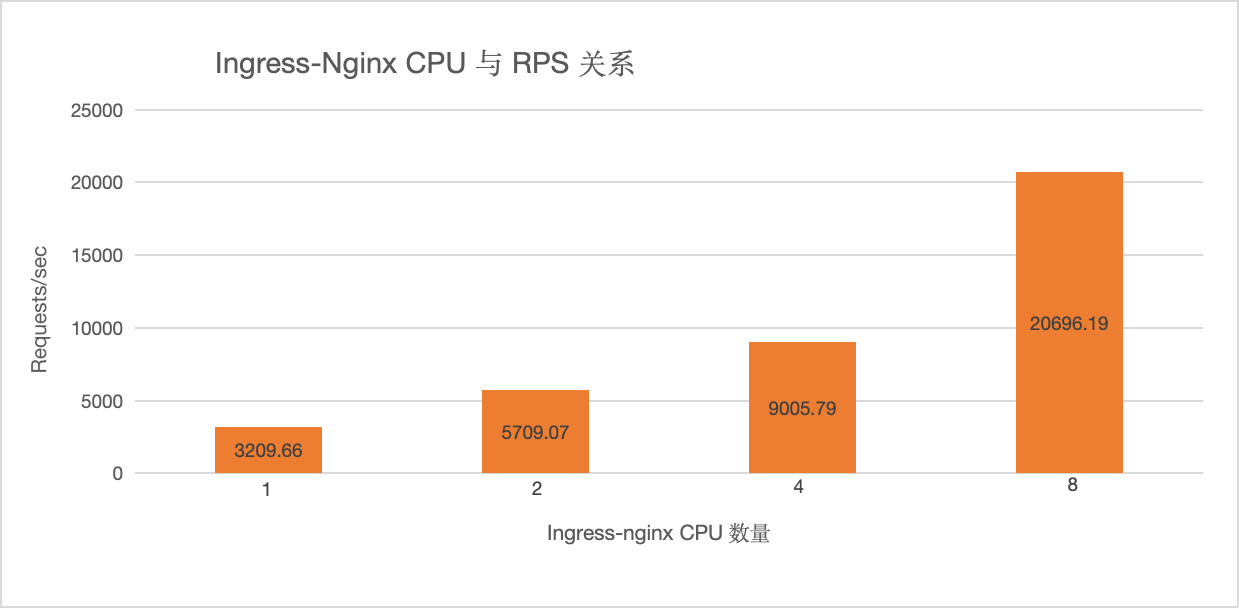
The following data is obtained from load testing on physical servers.
| Number of Ingress-nginx CPUs | (wrk) Requests/sec |
|---|---|
| 1 | 3209.66 |
| 2 | 5709.07 |
| 4 | 9005.79 |
| 8 | 20696.19 |
Relationship between Ingress-nginx CPU and RPS
Virtual Machine
| Name | CPU | CPU | MEM |
|---|---|---|---|
| Node 1 | Intel(R) Xeon(R) Gold 5118 CPU @ 2.30GHz | 16C | 16G |
| Node 2 | Intel(R) Xeon(R) Gold 5118 CPU @ 2.30GHz | 16C | 16G |
| wrk Client | Intel(R) Xeon(R) CPU E5-2680 v4 @ 2.40GHz | 56C | 128G |
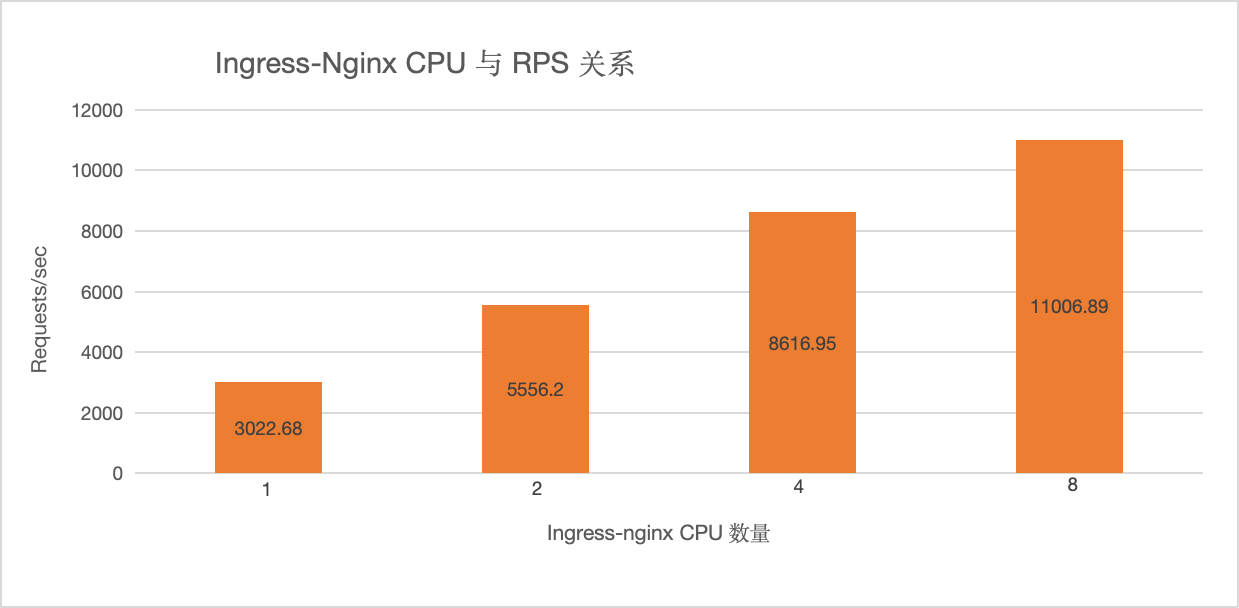
The following data is obtained from load testing on virtual servers.
| Number of Ingress-nginx CPUs | (wrk) Requests/sec |
|---|---|
| 1 | 3022.68 |
| 2 | 5556.20 |
| 4 | 8616.95 |
| 8 | 11006.89 |
Relationship between Virtual Machine Ingress-nginx CPU and RPS